Week 9, Were these standings inevitable?

Kevin, Mary Beth, Callum, and Rowan took that
draft-distracting trip to the Dominican Republic this year, the book is still
out if his team will forgive him for it

Cory is seen here with his offspring, Rum. Nuff said

Dave has entered the upper echelon of the Year-to-Date Power Ranks with a 2.93 rating. It’s Dave’s best rating since 2016, that year when he traded away two top 5 round keepers and had all those high-end picks. He peaked at a 2.42 (in week 8) Power Rank that year, we’ll see how high he can go this year. For perspective, in 2016, Dave ended the year as the number 2 seed but lost to Cory in the playoffs. In other power ranks news, MAX IS BACK ON THE CHART. Welcome. It took 4 starting pitcher adds on Saturday night to hit the innings pitched minimum on Sunday to do it. So happy for you, to steal two much-needed pitching points from Michael.

Looking at the Expected Week Win content, you can see Dave
and Dean really pulling away from the rest of us, both last week and over the
last 4 weeks. Paul would have been part of the pulling-away group but he scuffled
last week. Max and Robert, despite good weeks this week, have had a rough
month. Michael, Keith, Cory, Arthur, and Kevin are all floating in the middle
of performances over the last month. We’re one full rotation through the league
schedule, and we have one more rotation to go until the trade deadline, August
7th. Plenty of time to find our footing and make a run at the trophy.
But what about that draft advantage? Looking at the
standings right now, you see Dean, Paul, and Keith, who had that major draft
capital advantage, at the top of the standings, and you see Arthur, Michael,
and Max in the bottom 4. The power Rankings show a similar story, with Michael outperforming
his draft capital, somewhat (sitting in 6th), while Keith sits in 7th
in the power ranks. Paul had lagged early on before a very good three-week
stretch while Dean didn’t take advantage of his extra draft capital by drafting
a number of injured players and is only just now starting to see the rewards.
But is it that simple? I wasn’t content with the dive from
last blog that showed Dave doing awesome and Max’s draft showing less value
lost than the rest of us. While both those may be true, they didn’t tell enough
of the story.
I kept parsing the numbers, I updated the player valuations
through the end of week 9 and compared them to how each player has performed
compared to how they were valued on draft day, same as last time around. But
this time, I separated the data more by when the players were drafted and when
profits have been made on players and when losses have been taken
First up,

Ok so Dean blew it, right? Not so fast. You see here that
rounds 1-10 have an inordinate number of busts (18% of those picks are busting
at least a $20 loss), so Dean having 6 of
his 30 picks (5 of his top ten round picks) being a bust right now is functionally
been 2 of his first 10 (removing Strider, Kirby, and Acuna who have been hurt),
so he really performed right as expected.
Robert and Michael are the ones who appear to have really
blown it here with 7 all of these $20 or worse losses being taken in the first
13 rounds. So, what has been the difference between Dean vs Michael and Robert?
Let’s keep digging.
Next up, I looked at gains, who hit on more breakouts from
their draft picks and when were the breakouts drafted? Maybe that was it.

Ok so it was Cory and Dave that crushed the draft?! We’re
getting closer. Also note here how poorly that Robert, Arthur, Michael, and Max
performed in the first 20 rounds, with respect to breaking even on the players
they drafted. They have had the fewest top 20 round successful picks (profit greater
than $0.00) so far. We also see that the top 10 rounds saw more successful
picks (35) than rounds 11-20 (30). This makes sense, players drafted in the top
100, historically, have more stability, than picks 101 and later. So, because Robert,
Arthur, Max, and Michael had fewer picks in the top 100, it would make sense
that they would have fewer successful picks. Interestingly, between rounds 21
and 30, there are a whopping 45 players that have made a profit, but this is
because the bar is notably lower. Pick 201 had a value of $4, whereas pick 101
had a value of $11. It is far easier to earn $4 than $11, that’s why the metric
for the last 10 rounds of picks to measure success is higher, not just breaking
even.
What this establishes is that top 100 picks are surer bets
to break even than picks in rounds 11-20 and that despite Dean having more player
busts at this point, he drafted about as well as expected.
Let’s assume that we are benching or have cut at least some these players with at least $20 of loss so far, how much value beyond that have we pulled from our drafts? And now let’s start comparing how these look against how good our teams have been so far, using EWW as a simple metric to do this.

Now we’re talking, if you remove the bustiest of the busts
and stop worrying about value from players drafted after round 25, you can see
that the total value we have been able to use to reach out Expected Week Wins
is almost exactly matching the color of that EWW column. A correlation of 0.85
is very high. Dean and Robert have outperformed this comparison likely due to a
few good pickups since draft day (or in Dean’s case how he was able to hide the
lost value of his injured players with replacement level or thereabout pickups)
and Max has underperformed draft day value….likely due to NOT adding or
sometimes starting players (or having too many hitters on the bench with wasted
at bats). Keith and Arthur have also slightly underperformed their draft talent
and Michael has slightly overperformed.
Ok so the first take away is: have more early picks and you’re more likely to do well, but you also need to avoid busts. We should try to find breakouts, right? Well, this chart tells a different story. If we remove all breakouts who have returned more than $20 of profit, here is how the sum of those team values to this point have been:
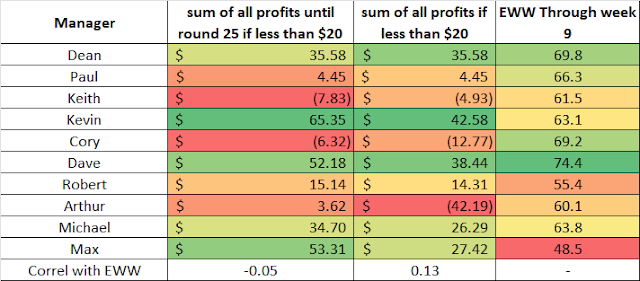
Nothing close to tracking with EWW, all of these
correlations to EWW are very low. The draft is about avoiding busts, not
finding breakouts. Having earlier picks helps, but as Dave’s draft shows, you
can find the right players in any set of rounds. Ok final chart, lets summarize
the various ways we’ve analyzed team value to date and compare it to Through
Week 9 EWW:

What I see here is that none of these other columns are anything
close to matching the colors of EWW. Ok we got it, draft early, avoid busts. But
what can I do now?
This is the crux of the question. What this data shows me is
that it’s only a correlation of 0.60 between draft day capital and week 9 team
value. That’s not nothing, but it’s not a certainty our current standings show
that having all the draft picks is going to lead to success next year. Our
sample size to analyze this is only 1 year deep, so there is likely a large
amount of noise in the data, but this is the first year where our draft capital
has really diversified. That said, it does show that trading away draft capital
isn’t likely to end your year…unless you also don’t actively manage your team
the next year like a certain someone that’s rocking the trophy next to his bed
right now.
Let’s have a fun summer and let the fireworks fly at the
trade deadline.


Comments
Post a Comment